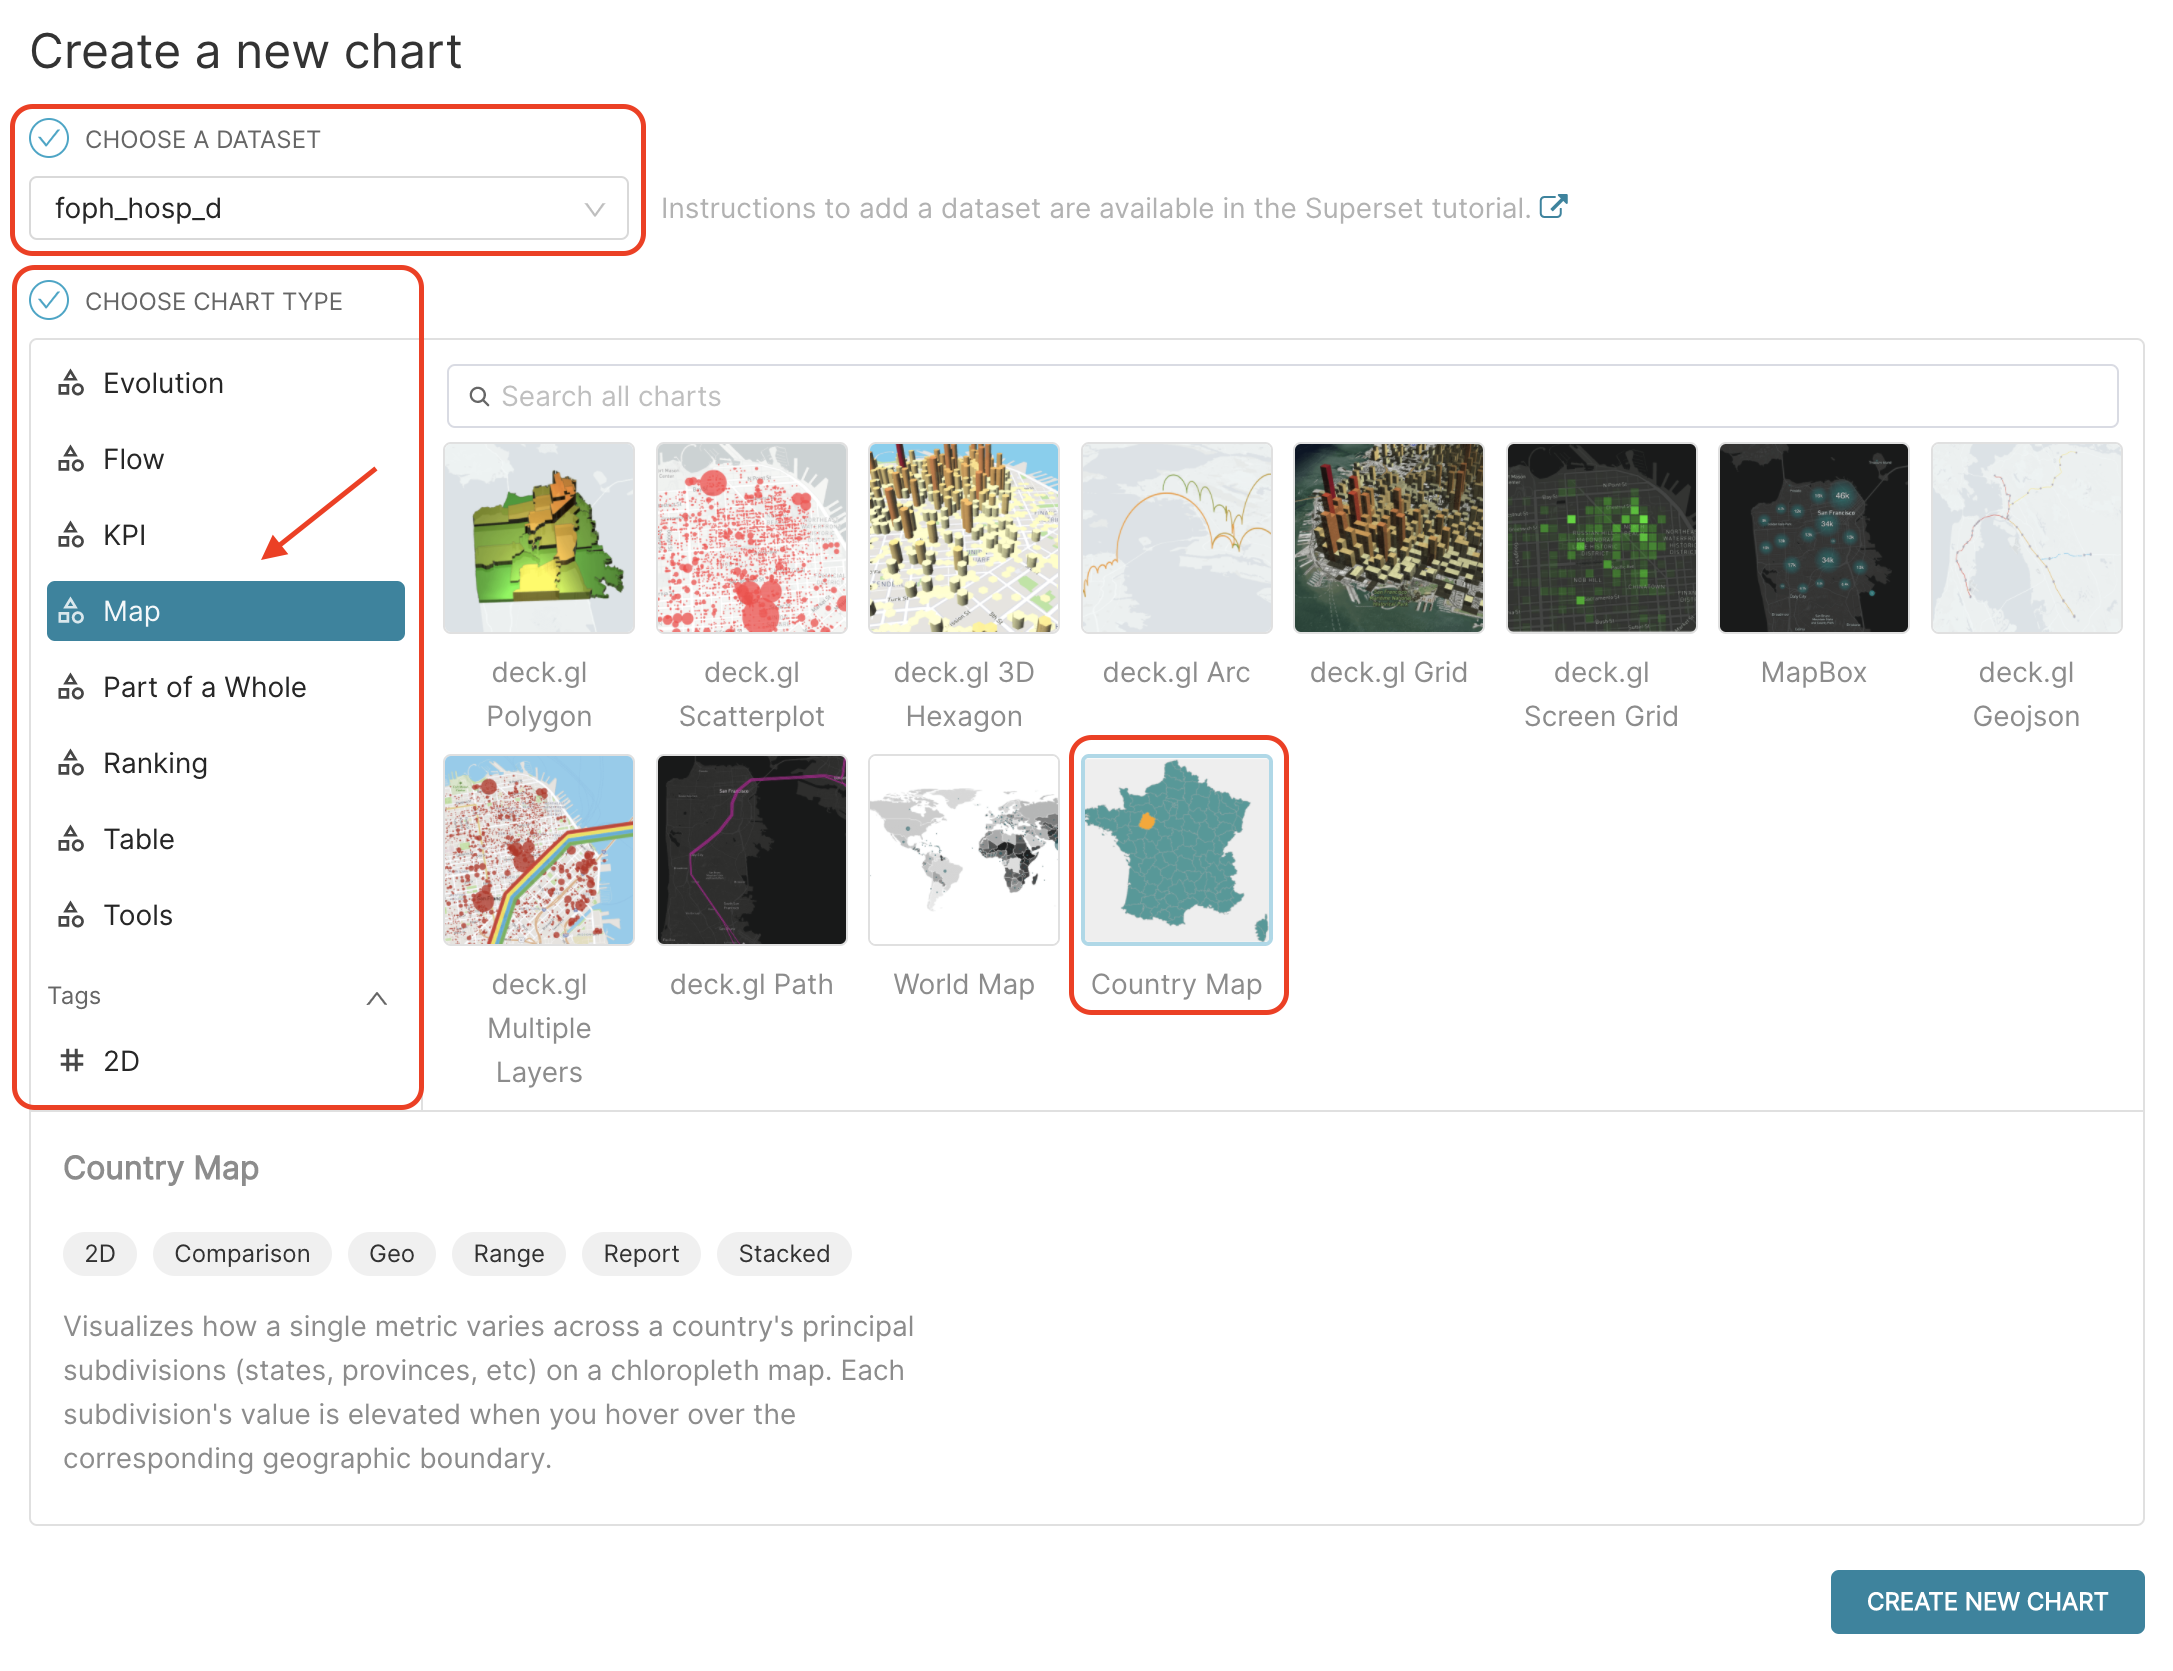
Country map chart
Now, let’s create a map chart:
Go to the Charts page, and
Click on the
+CHARTbutton.
Suppose we are interested in creating a Map providing an overview of COVID hospitalisations across Switzerland’s cantons during the last month, so:
In the field CHOOSE A DATASET, type
foph_hosp_d.In the CHOOSE CHART section, go to the Map Category, and select the
Country Mapin the right panel.Then, click on the
CREATE NEW CHARTbutton
 {width=”750px”}
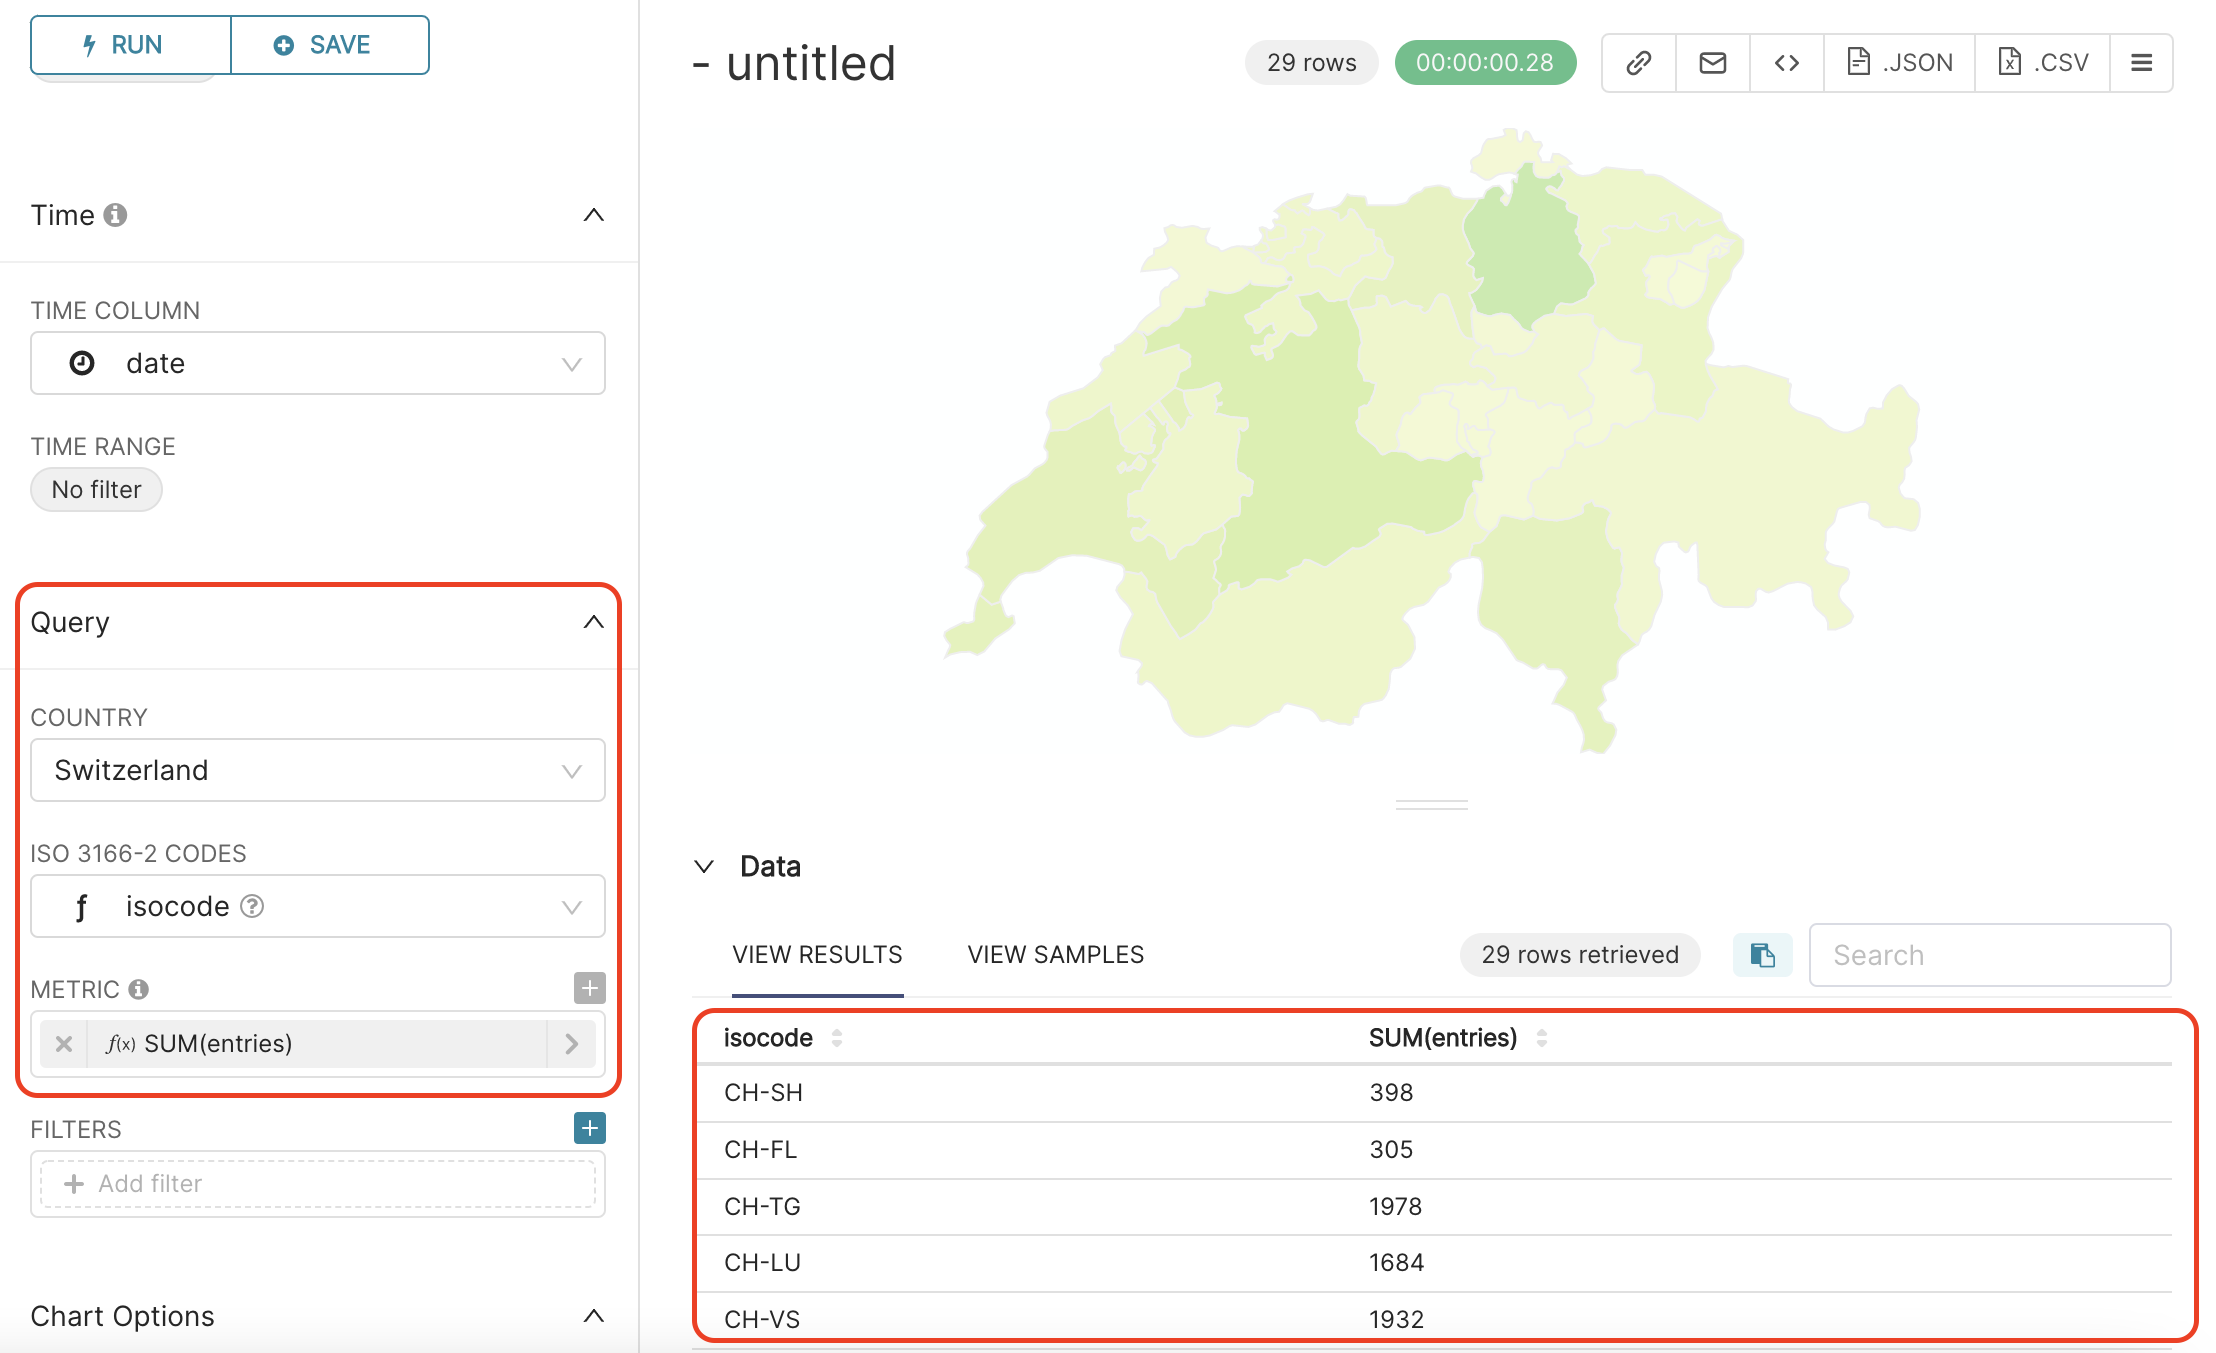
Query
In the Query section of the Chart Page, fill :
the COUNTRY field with
Switzerland,the ISO 3166-2 CODES field with
isocode, andthe METRIC field with
SUM(entries), as we did in the previous line chart.
click on the + symbol next to METRIC, select the SIMPLE panel, and set COLUMN to entries and AGGREGATE to SUM.
It should look like the following:
 {width=”500px”}
In this dataset, the isocode column allows us to link the canton data to the corresponding canton polygon on the country map. This isocode is a concatenation of the string 'CH-' with the value of georegion (‘CH’+georegion). For instance, canton Geneva, with georegion = 'GE', has and isocode = 'CH-GE'.
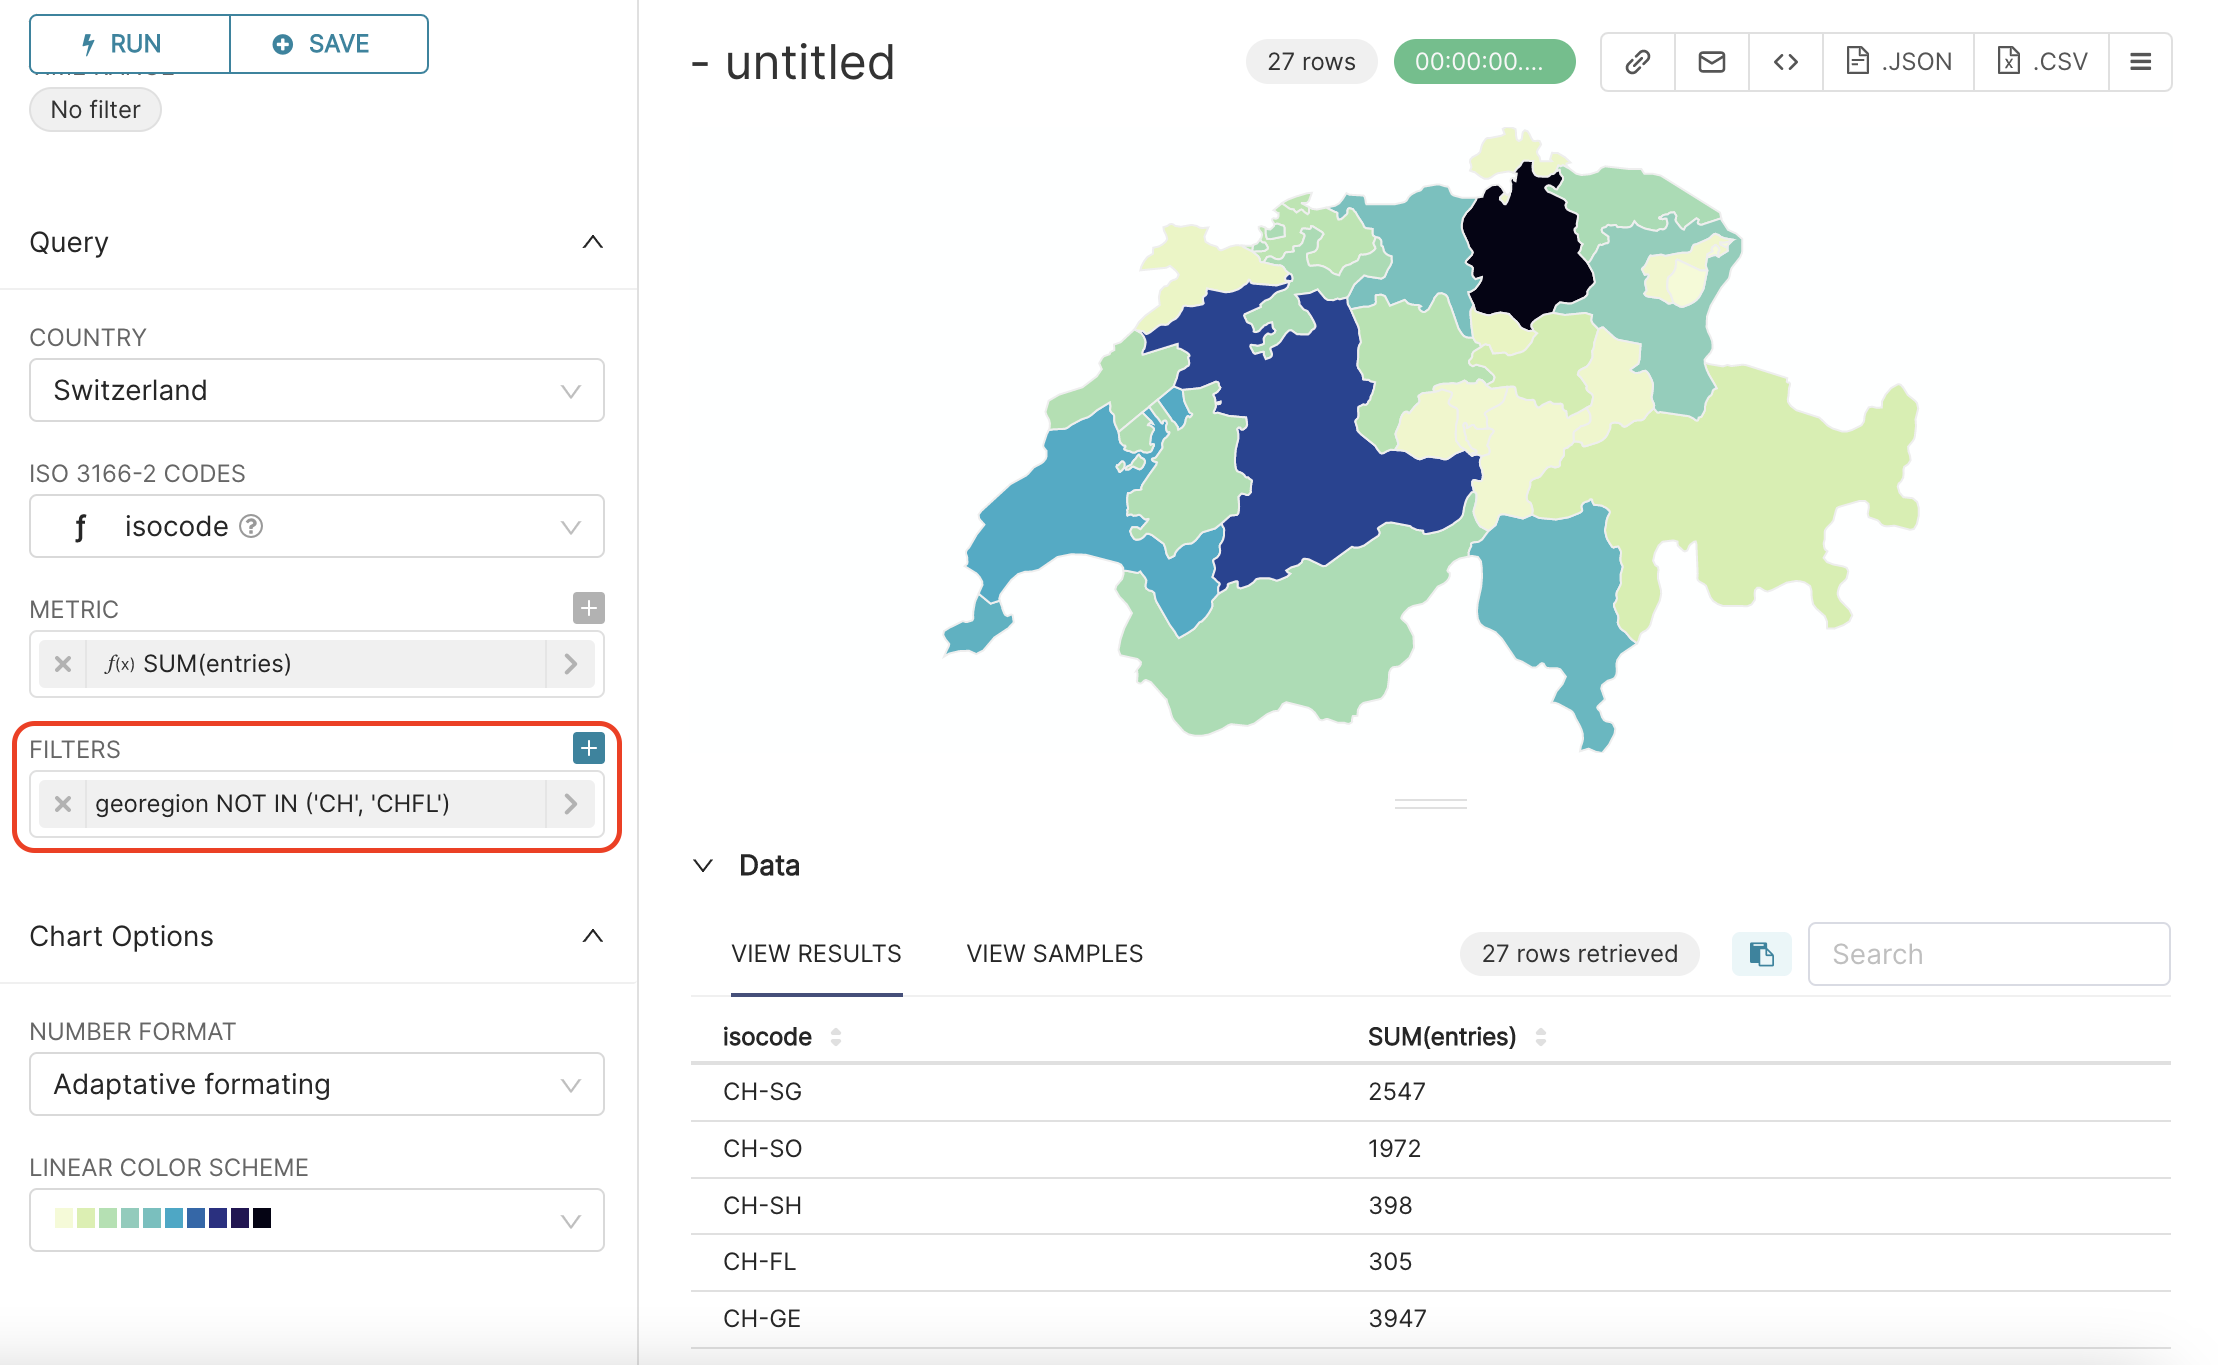
Filter
As we are interested here by canton data only, let’s again FILTER out data where georegion = ‘CH’ or georegion = ‘CHFL’. To do that, we will add a filter georegion NOT IN (‘CH’,’CHFL’), and RUN QUERY again, as follows:
 {width=”500px”}
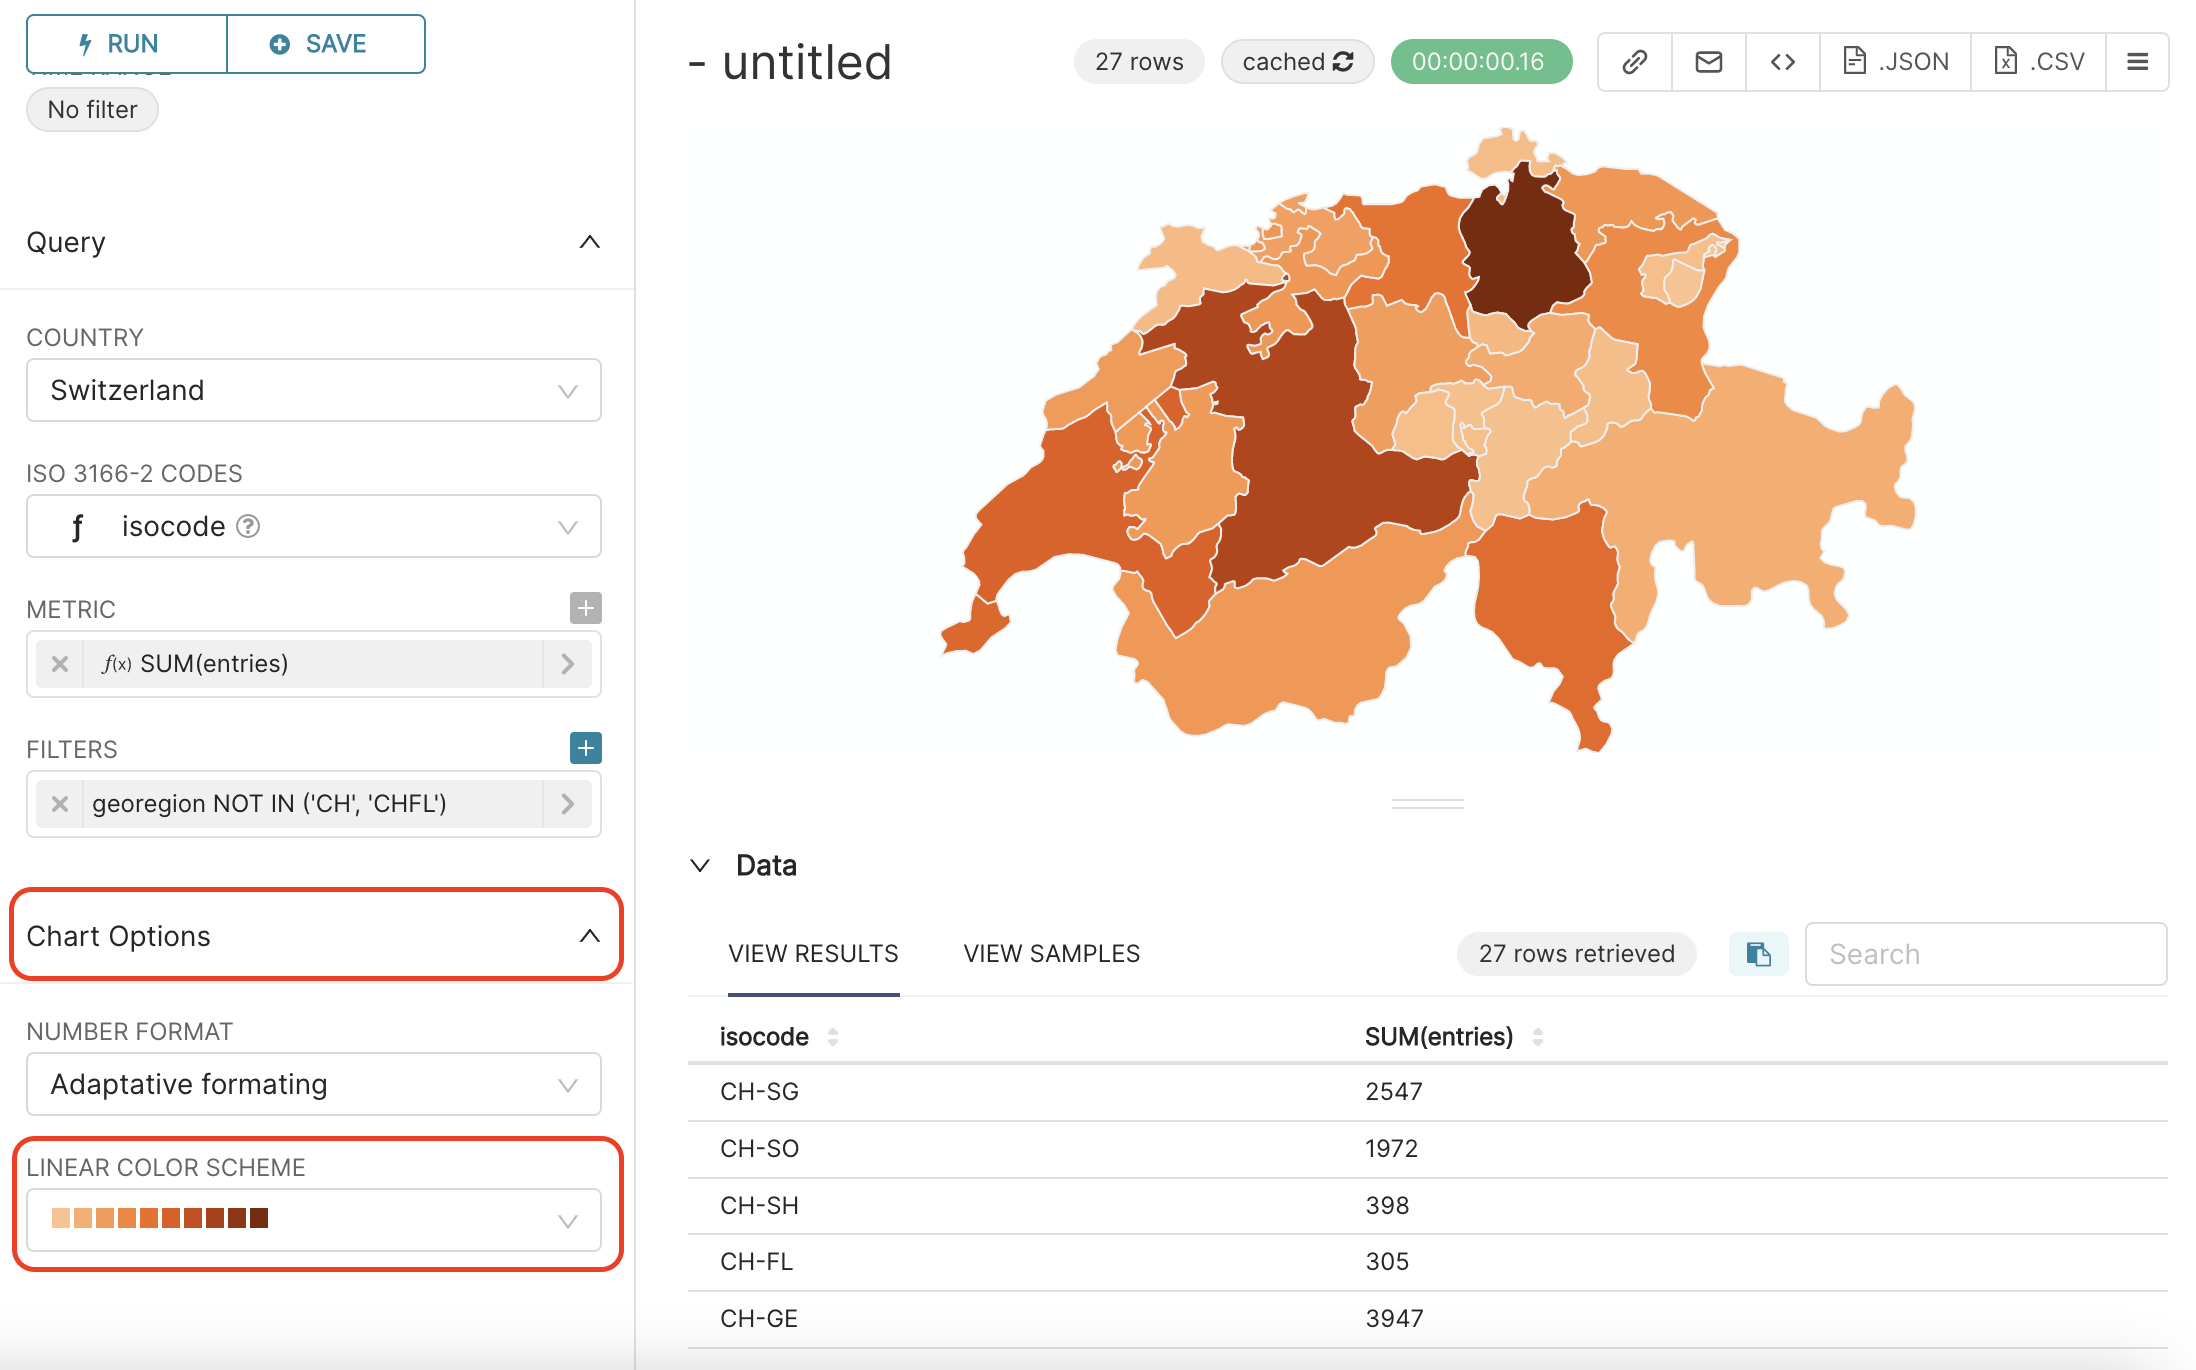
Color scheme
If you are not fan of the color scheme, you can change it, by going to the Chart Options section (under the Query section), selecting for instance oranges in the LINEAR COLOR SCHEME field, and RUN QUERY again, to get the following result:
 {width=”500px”}
It does look quite nice :) What do you think?
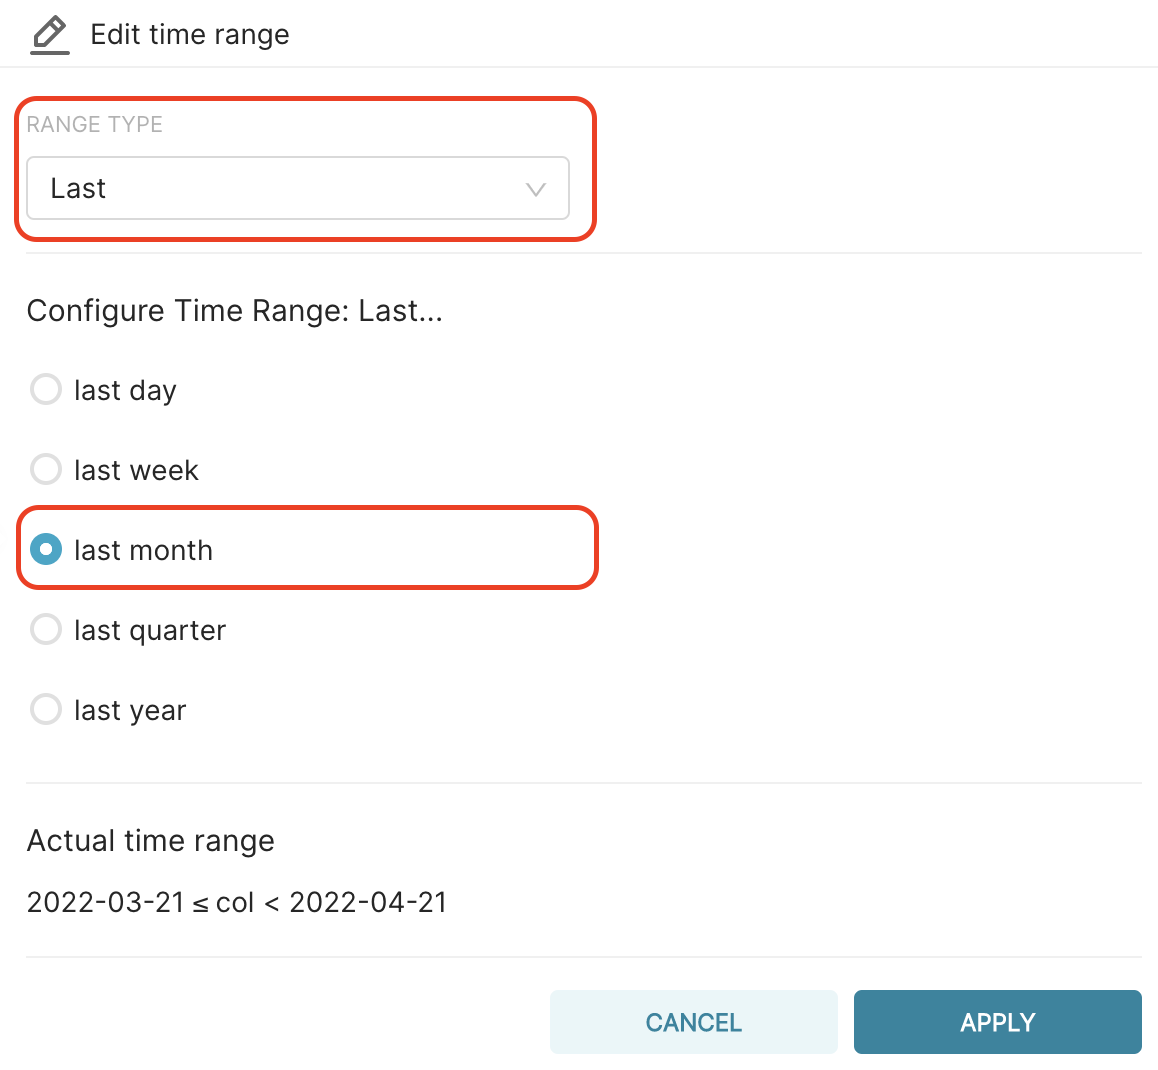
Time range
As we did not edit the time-related elements yet, you have now on your map the total number of hospitalisation entries per canton, since February 2020, while we are interested by last month’s hospitalisations only.
To correct that, we should go to Time section in the middle panel, and set TIME RANGE to last month. For that, click on No filter value in the TIME RANGE field; this will open a pop-up window named Edit time range.
There, select:
Lastin RANGE TYPE,select
last monthin Configure Time Range Last…:, andclick on the
APPLYbutton in the bottom right of the window. The window will close and you will be able toRUN QUERYagain.
 {width=”500px”}
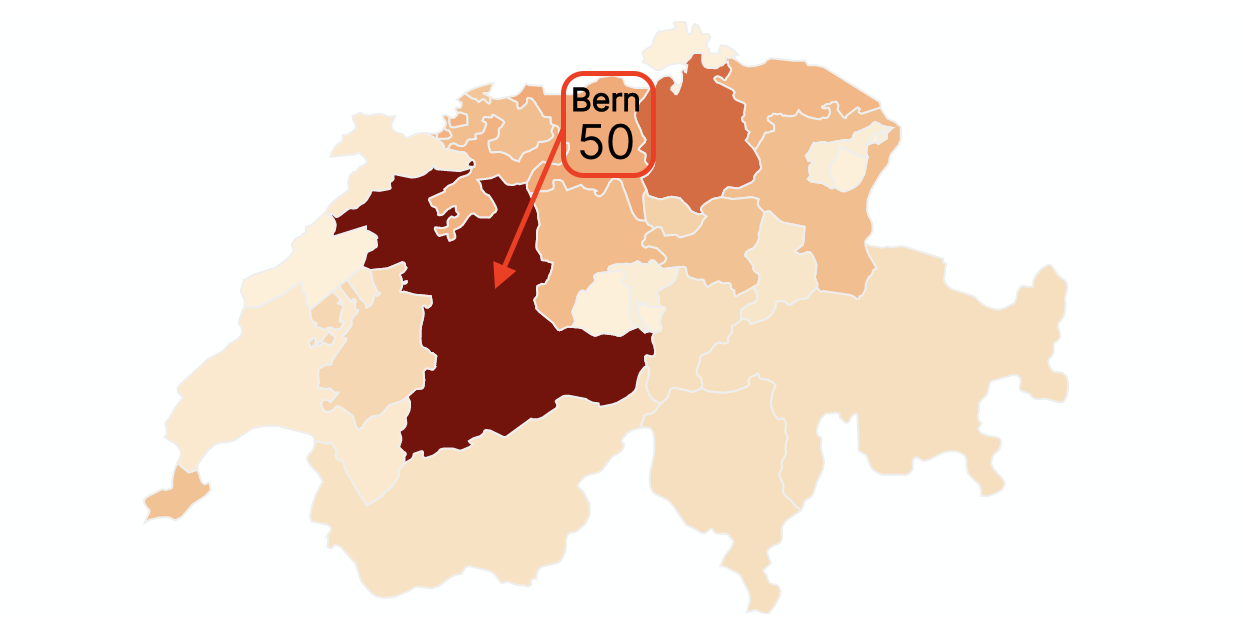
Dynamic map
Below is the resulting map. Notice that the map is dynamic, when you pass your mouse over the cantons on the map, the name of the canton and the number of hospitalisation entries in this canton appear.
 {width=”500px”}
Finalise chart
It is now time to :
Specify a title for the chart, for instance
Number of COVID hospitalisations during last month,Save it, by clicking on
+SAVEbutton in the middle panel.