Data Sources and Aquisition
Epigraphhub database aggregates data from multiple sources which are collectd and kept up to date via our data aquisition automation system.
All the data coming from an external source should give origin to on or more tables organized in schemas. For example, maps should be stored in the map schema.
Manual data entry
Data can be uploaded manually via the Epigraphhub Superset web interface or programatically, by connecting directly to the database. In order to connect a SSH tunnel must be established using the user epigraph
ssh -f epigraph@epigraphhub.org -L 5432:localhost:5432 -NC
Now we can use either Python or R to upload the data.
Using Python
Once the tunnel is established data can be sent to the data base using Pandas:
import pandas as pd
from sqlalchemy import create_engine

engine = create_engine("postgresql://epigraph:epigraph@localhost:5432/epigraphhub")
Suppose you want to upload a map, in this case you will need Geopandas:
import geopandas as gpd

mymap = gpd.read_file('mymap.shp')
mymap.to_postgis("public.mymap", engine, if_exists='replace')
Above, public is the schema holding all the maps.
For a more complete example for loading all the GADM maps, check this script.
To Import CSVs you can use the web interface. Or the direct database connection as shown above
import pandas as pd
df = pd.read_csv('myspreadsheet.csv', delimiter=',')
df.to_sql('myspreadsheet', engine, if_exists='replace')
Using R
Once the tunnel is established data can be sent to the data base using the package: RPostgreSQL
# install.packages("RPostgreSQL")
require("RPostgreSQL")

# loads the PostgreSQL driver
drv <- dbDriver("PostgreSQL")
# creates a connection to the postgres database
# note that "con" will be used later in each connection to the database
con <- dbConnect(drv,
                dbname = "epigraphhub",
                host = "localhost",
                port = 5432,
                user = "epigraph",
                password = 'epigraph')
To Import CSVs you can use the web interface. Or the direct database connection as shown above using the code below:
require("RPostgreSQL")
data <- read.csv('myspreadsheet.csv')
dbWriteTable(con, c('public', 'myspreadsheet'), data, overwrite = TRUE)
The first value in c('public', 'myspreadsheet') represents the schema where the table will be saved, and the second the table name.
Spreadsheets
To import spreadsheets one easy way is through Google sheets. You need to give the spreadsheet you want to read from Epigraphhub and permission to anyone that has the link to view the file.
As an example, let’s use the table: https://docs.google.com/spreadsheets/d/12rGwhwuIJuRZJ3eqfQUfuRK6yDSoTP9_Y4S_KidTyMY/edit?usp=sharing.
After clicking on the link, the page below will appear. (The steps explained below work with any table saved in Google Sheets.)
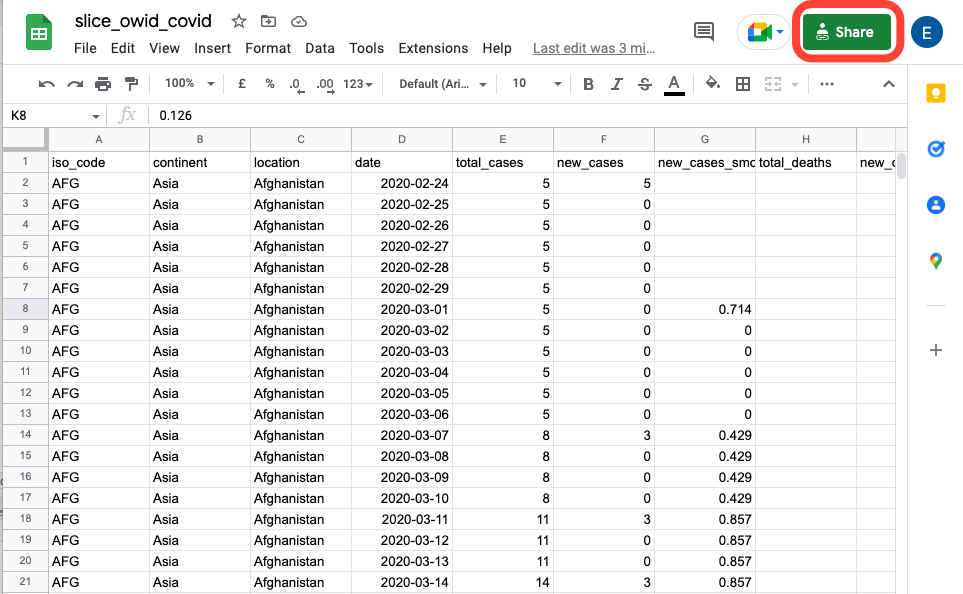
Click on the Share button highlighted above and the two boxes below will be displayed in your screen:
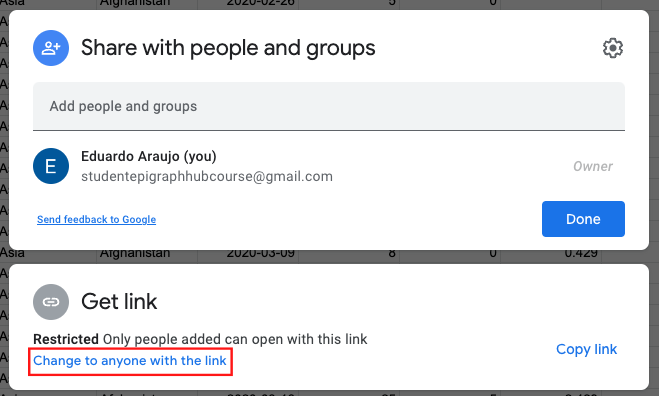
In the Get link box, you need to allow your table to be shared with anyone with the link. If you have already done it, the following box will be displayed:
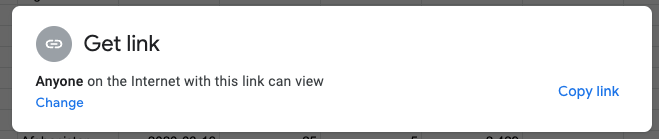
So, click on the Copy link. Otherwise, if your table is not yet available for anyone with the link, you need to click on Change to anyone with the link, so you will see on your screen:
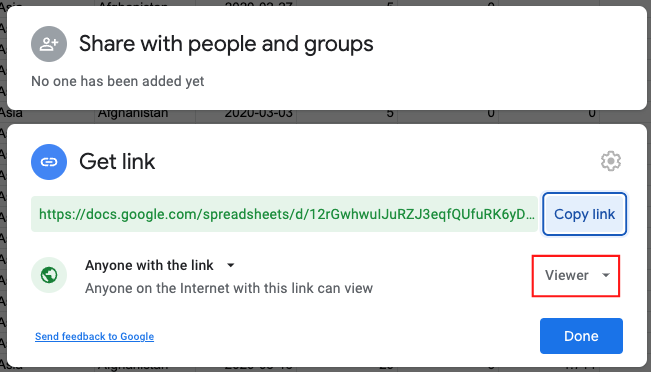
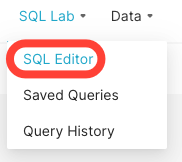
Click on the Copy link and on Done. By doing that you just allow the Viewer mode of your table. It doesn’t allow other people with the link to edit your table. After copying the link, we will go back to the EpiGraphHub platform and will select the SQL Lab and the SQL Editor option.
After clicking on it, the page below will be displayed on your screen. On this page, it’s possible to make multiple SQL queries. You can open a new query by clicking on the plus button highlighted below.
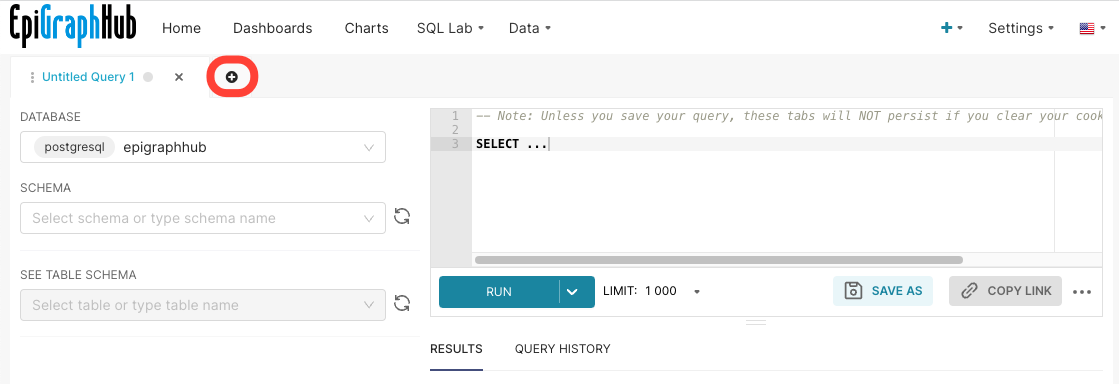
On the left side of the page, you can select the DATABASE and SCHEMA. On the right side, you can type your SQL query and run it clicking on the RUN button.
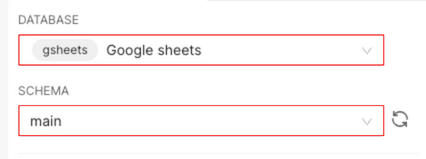
To upload a table from Google Sheets you must use the Google sheets DATABASE and the main SCHEMA, as shown below:
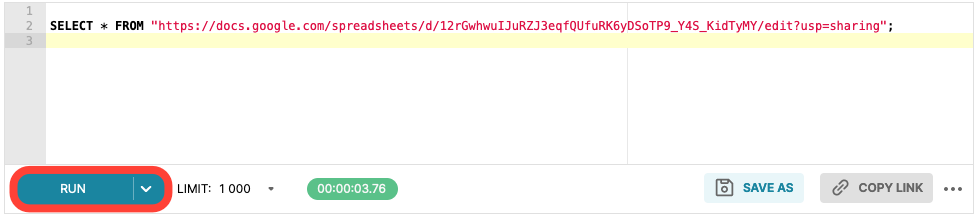
In the field to type the query, just type:
SELECT * FROM "Google Sheets link";
and click on the RUN button. In the Google Sheets link use the link copied above. Your final query is:
After running the query, the result below will be displayed on your screen:
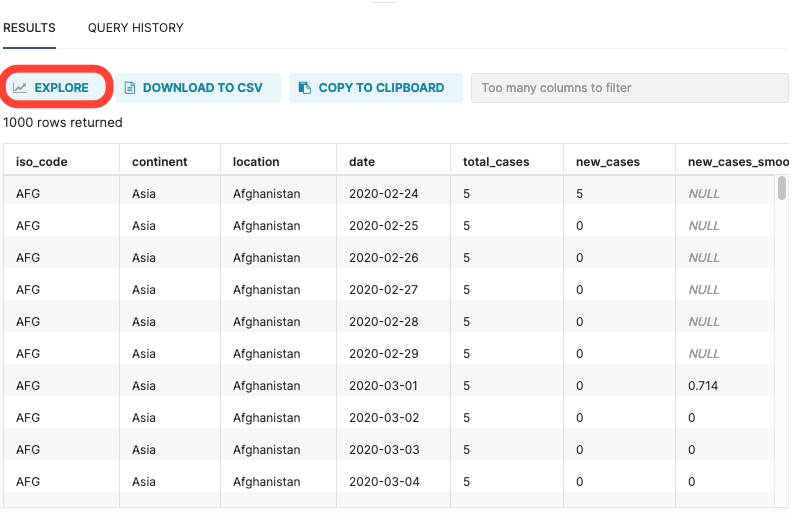
To save this dataset and explore it click on the EXPLORE button. This window will be displayed:
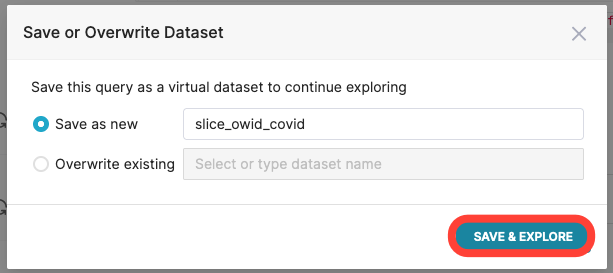
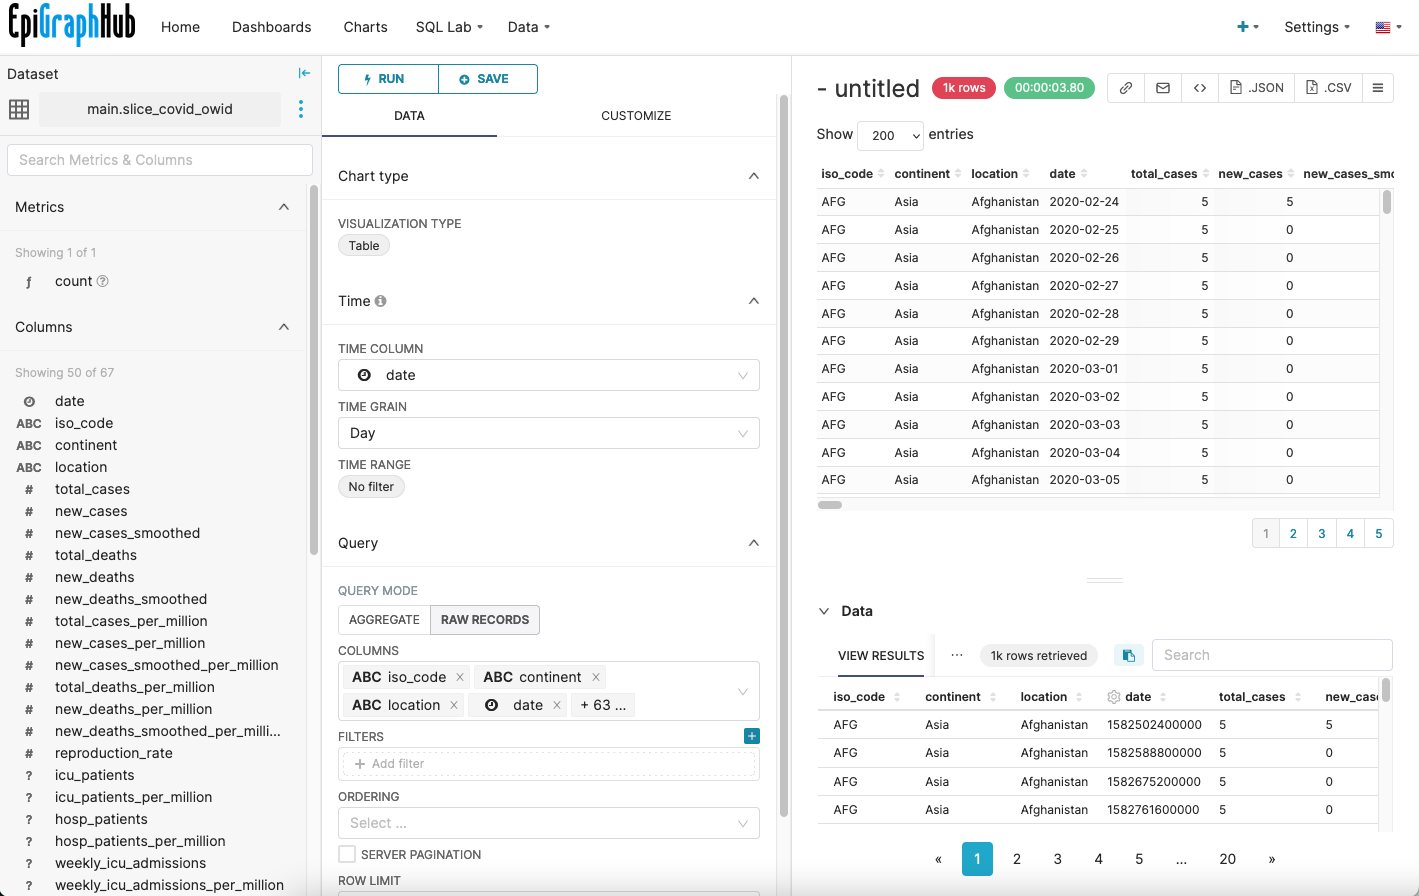
You can save it as a new dataset (choosing a name) or overwrite an existing table. So, choose a name and click on the SAVE & EXPLORE button.
You will be redirected to the explore page, where you can make charts and explore your data.
Data sources
The sources below are kept up-to-date in the epigraphhub database.
Our World In Data COVID-19 data. This dataset is updated daily on the the database and is accessible via the EpiGraphHub API.
GADM maps. All GADM maps with all available administrative levels are available in the Hub database. This chart, for example shows the centroids of Guinea’ admin 3 regions.
FOPH COVID-19 data. All the datasets made available by the FOPH - Federal Office of Public Health - regarding the COVID-19 data in Switzerland are available on our platform and updated regularly.
Instituto Nacional de Salud COVID-19 data. This source provides the data of positive COVID-19 cases in Colombia. This data is updated daily in our platform.
Google Health COVID-19 open data All the datasets made available by the google regarding the COVID-19 data. This data is updated daily in our platform.